Screen Rendering for iOS
Detect Slow and Frozen Frames in your app’s screens and debug their root cause.
Minimum Required SDK Version
Screen Rendering is supported starting Luciq SDK version 19.2
Luciq automatically detects any frozen frames or slow frames that your user experiences while using the app. These delayed frames and other critical debugging information is grouped automatically by screen. Learn which screens are experiencing the poorest rendering performance, understand what segments of users are impacted the most, and what spans and operations might’ve caused these issues down to the single occurrence level.
Metrics and Definitions
Luciq automatically detects when your app experiences these rendering issues:
- Frozen Frame: Any frame that takes longer than 700 ms to render on devices running at 60 FPS.
- This is a frustrating experience for your users and should not be tolerated on your app.
- It also negatively impacts your Play Store ranking.
- Slow Frame: Any frame that takes longer than 16ms to render on devices running at 60 FPS.
- This threshold changes according to the refresh rate of the device; it is calculated as (1/refresh rate) seconds.
- The Luciq SDK automatically detects the refresh rate and dynamically adjusts this threshold for different devices and configurations.
For each screen visit, Luciq aggregates this data into the following metrics:
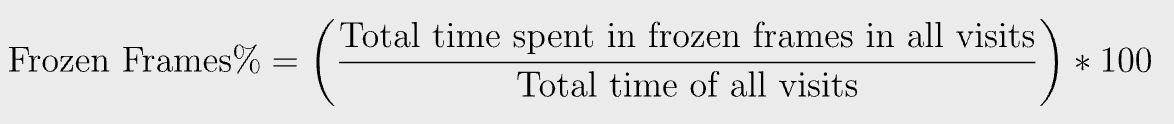
- Frozen Frames %: The percentage of total time users spent on the screen that was spent in a Frozen Frame.
- e.g. if a user spent a total of 10s on a screen, within which they experienced a 2s frozen frame, this screen will have a Frozen Frames % of (2/10) = 20%
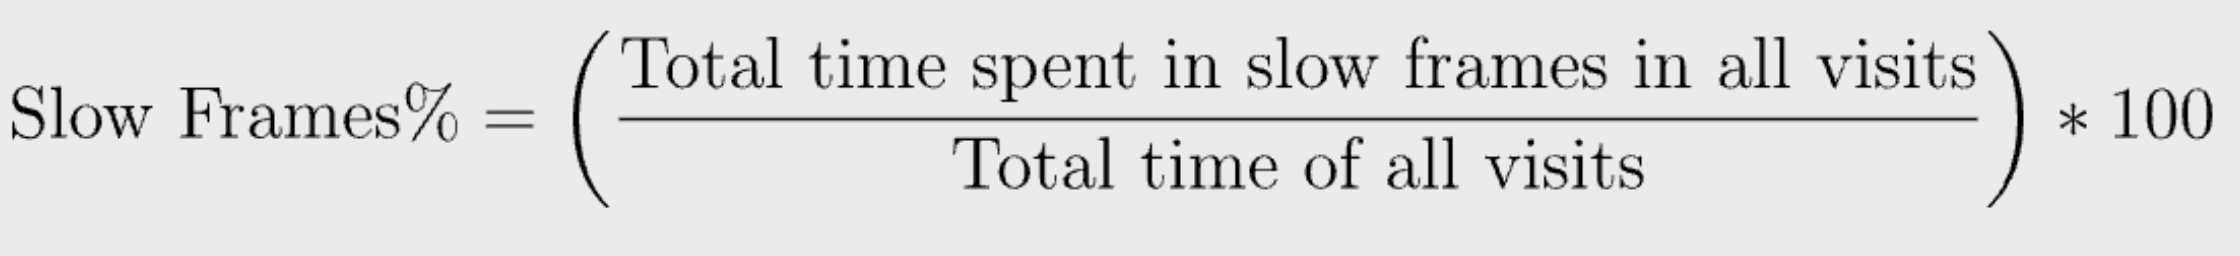
- Slow Frames %: The percentage of total time users spent on the screen that was spent in a Slow Frame.
- e.g. if a user spent a total of 10s on a screen, within which they experienced a total of 1s in slow frames, this screen will have a slow Frames % of (1/10) = 10%
The same calculation is used to aggregate the performance of all visits of a single screen.
For entire screen groups, the frozen and slow frames % are calculated collectively.
Features
Trends
Understand your screen’s rendering performance over time.
- Track your screen’s rendering Apdex over time.
- Analyze throughput to understand user traffic on that screen.
- Monitor Frozen frames and Slow Frames over time to identify spikes.
- View distribution graphs to understand how frequent different severities of slow and frozen frames are happening on the screen.
Suspect Spans
Identify spans that most commonly correlate with Slow and Frozen Frames. These spans are likely root causes of rendering issues on this screen.
iOS supports the following spans in Screen Rendering:
- Screen Loading Stages
- Database Queries
- Network Requests
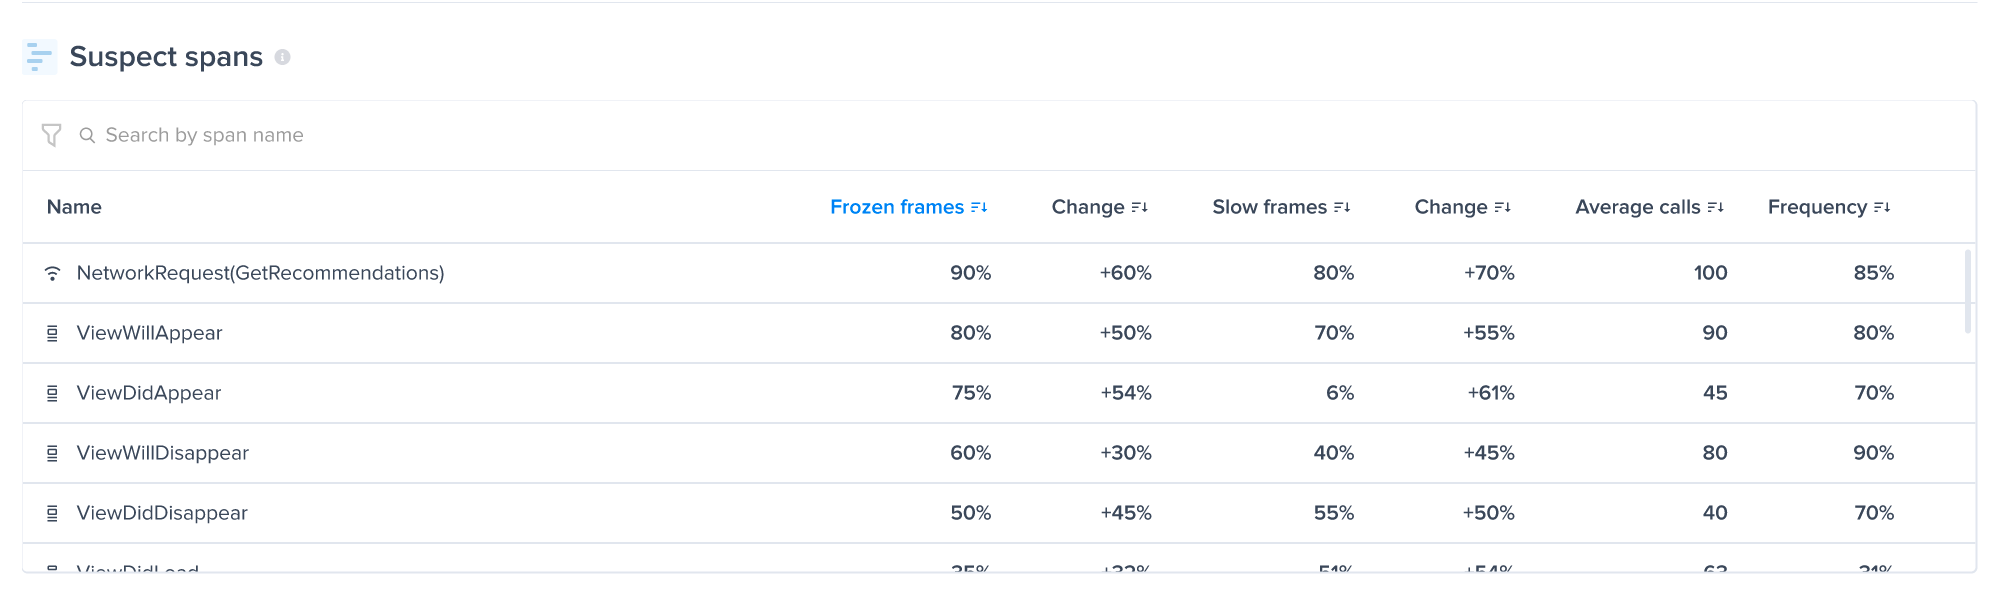
The suspect spans table shows for every span captured on this screen:
- Frozen Frames %: What percentage of the occurrences of this span correlated with a frozen frame.
- Slow Frames %: What percentage of the occurrences of this span correlated with a slow frame.
- Change: How each of those percentages changed in the selected date period compared to the previous period of the same length.
You can learn more about spans and how they can help you identify the root cause of performance issues in the documentation.
Patterns
Understand your rendering performance across different dimensions: App versions, Devices, OS versions, etc., allowing you to narrow down into segments of your user base to identify and debug issues.
Occurrence View
Navigate to the occurrences page of any screen to view individual screen visit occurrences in full detail.
- View metadata about each occurrence, including frozen and slow frames %, device and app information, and other parameters.
- View a detailed span timeline of the complete screen visit, highlighting frozen frames (in red) and slow frames (in yellow).
- Hover over any frozen or slow frame to highlight that frame’s suspect spans, a likely root cause of this rendering delay.

Customizing Screen Grouping
By default, screens are grouped by Activity. However, you can adjust how Frozen and Slow Frames are grouped by configuring Custom UI Traces. These act as their own screen, and any frozen/slow frames that occur when a custom UI trace is active will be aggregated in a new group under that custom UI trace.
- You can run only one custom UI trace at a given time; a trace must be ended before a new one can be started.
- The SDK will end any occurrence that wasn't explicitly ended via the end API.
Start Custom UI Trace
You can use the API below to mark the start of a UI trace. It takes as input a trace name that we use to aggregate the data of relevant occurrences together on your dashboard.
// Start UI Trace
APM.startUITrace(withName: "name")
// Start UI Trace
[LCQAPM startUITraceWithName:@"name"];Rules around creating UI Traces:
- Trace name can be up to 150 characters. Any extra characters are truncated.
- Trace name can't be nil or an empty string.
- Avoid adding any of these special characters
[, (, ), =, {, }, <, >, /, , ](commas not included) as they will be replaced with_.- Starting a new trace has to be done after initializing the SDK.
End Custom UI Trace
Use the API below to end the trace occurrence that you have already started:
// End UI Trace
APM.endUITrace()
// End UI Trace
[LCQAPM endUITrace];Note: Please note that Custom UI Traces do not interfere with Automatic Screen Grouping; both can run in parallel.
Apdex Calculation
Luciq calculates an Apdex score that reflects the rendering performance of every screen or custom UI trace of your application. Instabug calculates an Apdex score that reflects the performance of your Flows. An Apdex score ranges between 0 and 1; the higher the value, the better the performance:
- Apdex score ≥ 0.94 equates to Excellent performance.
- Apdex score ≥ 0.85 and < 0.94 equates to Good performance.
- Apdex score ≥ 0.7 and < 0.85 equates to Fair performance.
- Apdex score ≥ 0.5 and < 0.7 equates to Poor performance.
- Apdex score < 0.5 is considered Unacceptable.
The following color-code criteria is also applied:

How is the Screen Rendering Apdex Calculated?
Every screen visit is categorized based on the frozen frames % and slow frames % of that occurrence. Based on the following logic:
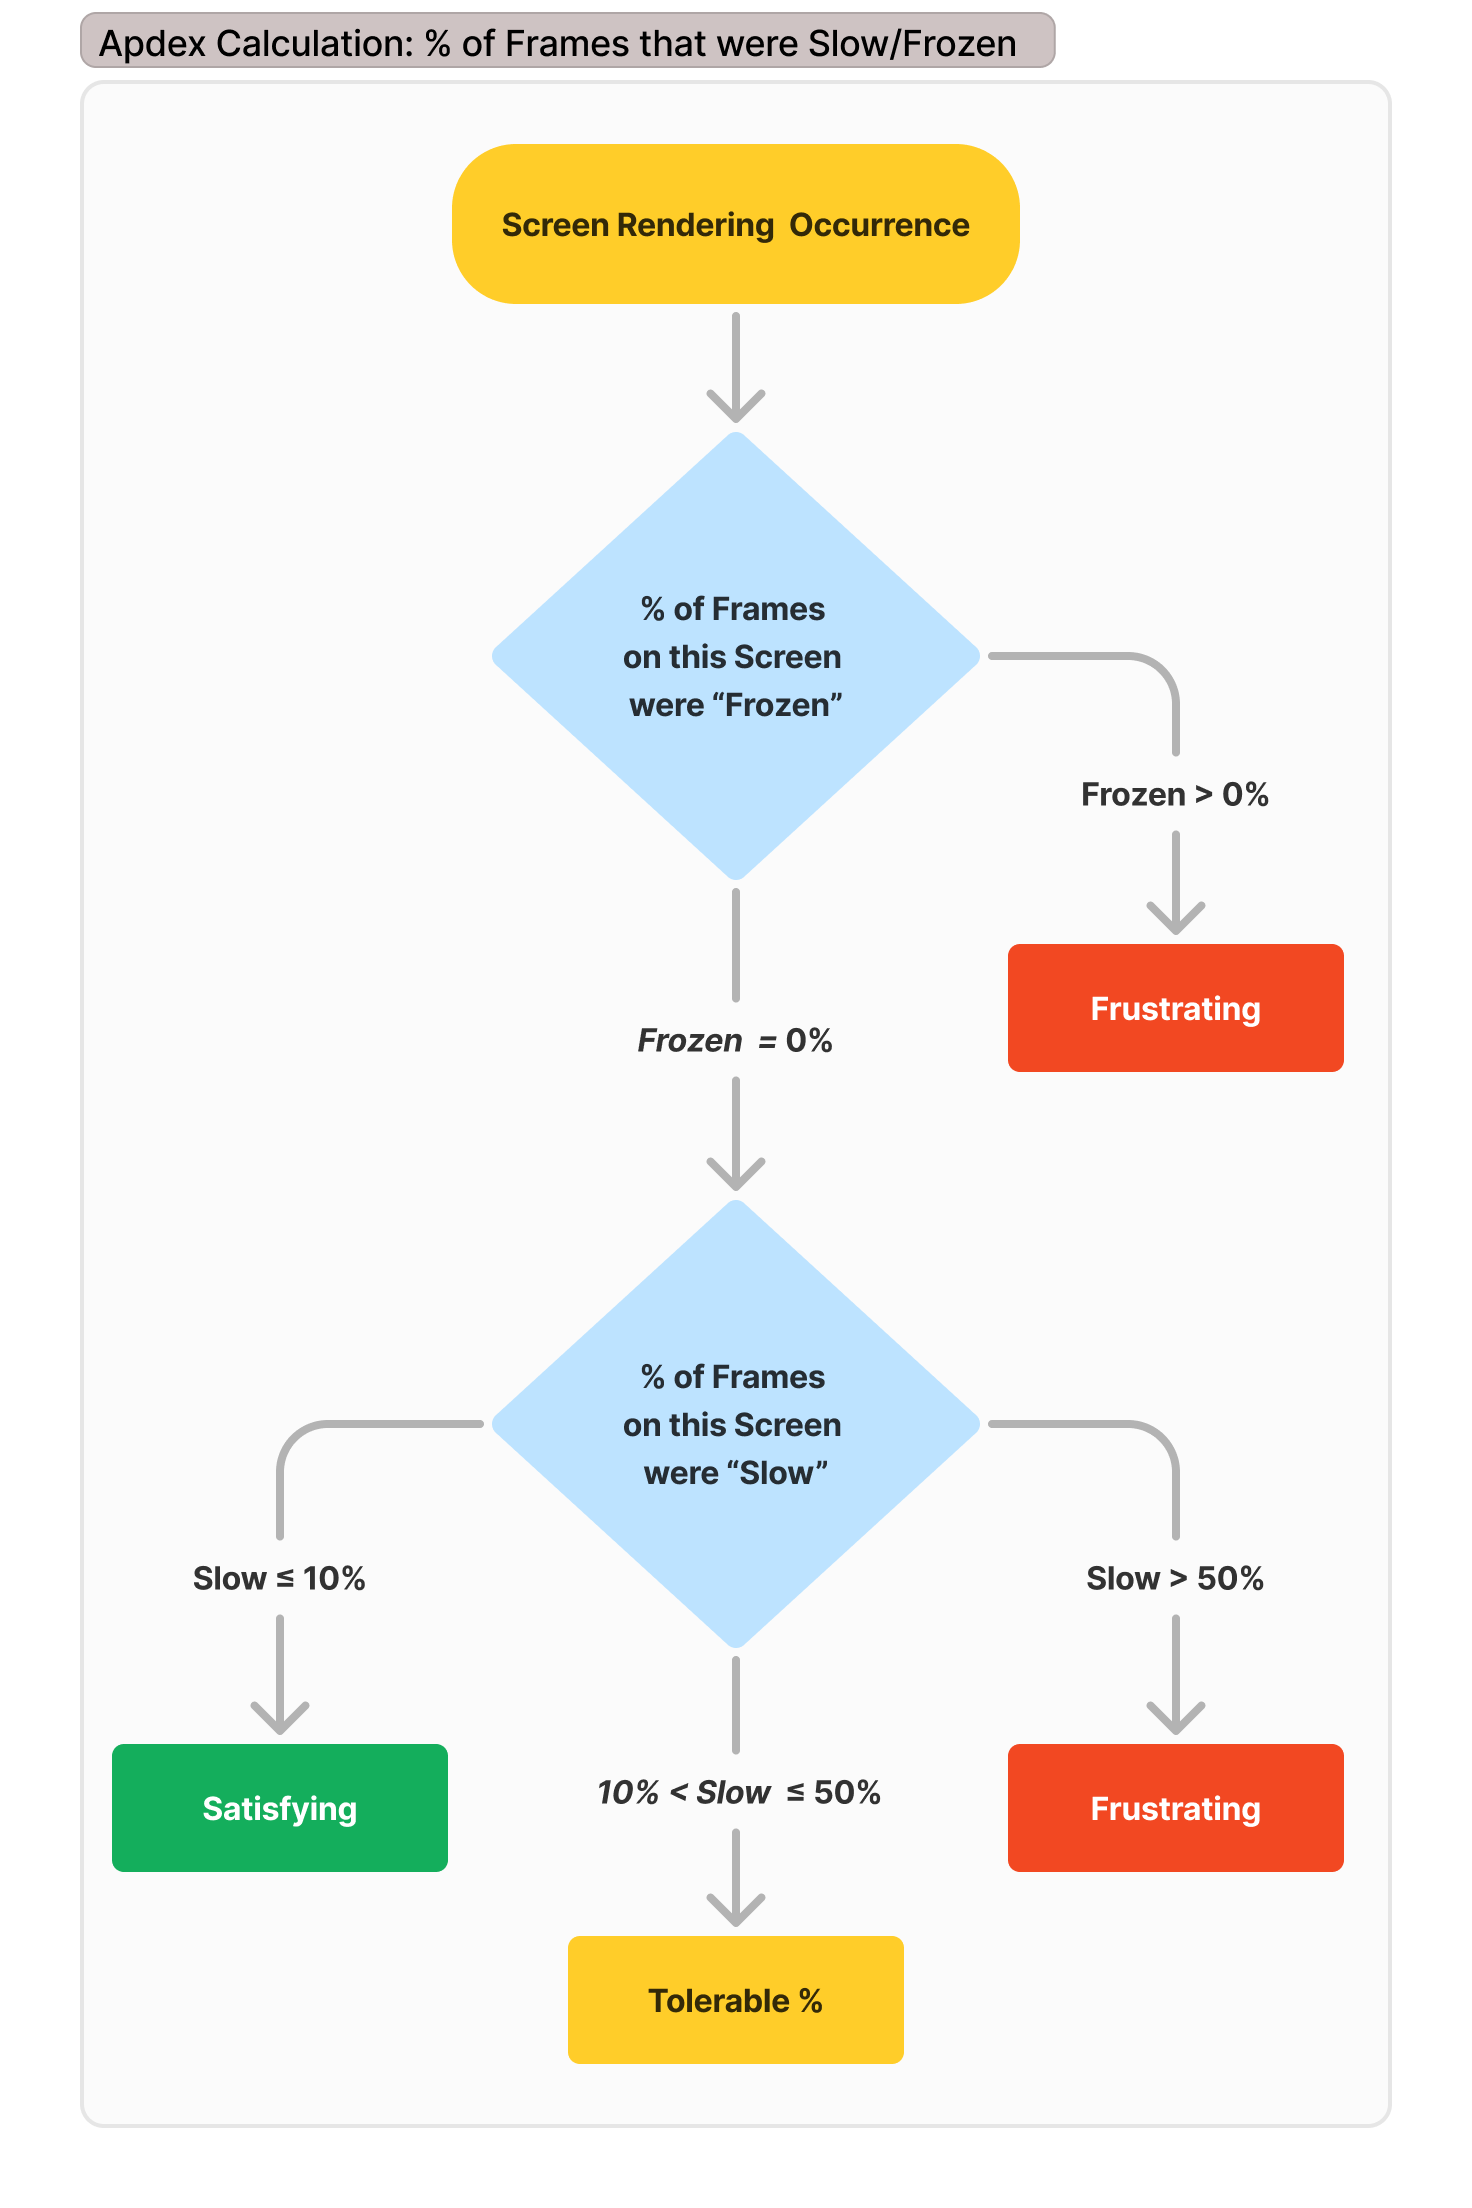
Following that logic, a Screen rendering occurrence is considered:
- Satisfying: if it has NO frozen frames & ≤ 10% Slow frames.
- Tolerable: if it has NO frozen frames & ≤ 50% Slow Frames.
- Frustrating: if it has ANY frozen frames & > 50% Slow Frames.
Screen Group Apdex Calculation
The Apdex score for the entire Screen Rendering group is then calculated as follows:
Apdex score = (Satisfying occurrences + 0.5 * Tolerable occurrences) / Total occurrences
(Where: Total occurrences = Satisfying occurrences + Tolerable occurrences + Frustrating occurrences)
Example: If a Screen had 3 occurrences:
- 5% Frozen Frames, 0% Slow Frames → Frustrating
- 0% Frozen Frames, 30% Slow Frames → Tolerable
- 0% Frozen Frames, 6% Slow Frames → Satisfying
Apdex for that screen =
(1 satisfying occurrence + 0.5 * 1 tolerable occurrence) / 3 total occurrences = 0.5
Enable/Disable Screen Rendering
Luciq collects Screen Rendering performance metrics out of the box. If needed, you can disable it by calling the following API after initializing the SDK.
// Disable Screen Rendering
APM.screenRenderingEnabled = false
// Disable Scren Rendering
LCQAPM.screenRenderingEnabled = NO;Updated 11 days ago